Picturing the Oil Roller Coaster
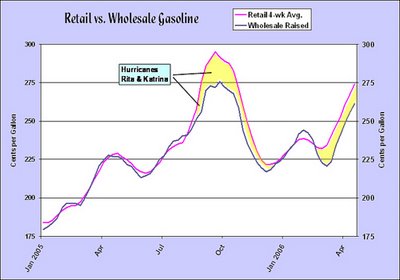
 Here's a graph from the Oil CEO that illustrates a little more than a year of the changes in retail and wholesale prices in gasoline. And yes, it's a rollercoaster. The future is hard to predict but the graph may be illustrating the prices of the next few years with a generally upward trend.
Allow me to go off on a tangent for a moment. Notice that when the pink line falls below the blue line, retailers are losing money. The retailers that generally get hit the hardest are independent gas stations. If the independents lose too much money, they go under.
Many of us are old enough to remember that before the energy crisis of the 1970s, gas stations around the United States were more numerous per capita. I haven't seen statistics on it but I suspect the total number of stations will remain stable but as we have seen in recent years frequent changes of owners will continue. I bring this up because I favor small businesses and even small corporations because they're the backbone of a truly competitive economy and they provide jobs. There has been a growing tendency of large corporations to provide fewer American jobs per million dollars of gross income than their smaller counterparts.


0 Comments:
Post a Comment
<< Home